Step 1One number per stock
Every 15 minutes, each of about 1,900 stocks and ETFs gets a signal from 0 to 1. Higher means the model sees a stronger case to own that name right now. The score is relative: every name is ranked against all the others that day, so 0.65 is a strong place in the ranking, not a 65% chance of a rise.
Three labels do the talking. BUY the case has tipped in favour and the model is not already holding the name. TRIM take some off, not a full exit: price has reached the top of its band, or slipped through its trade level. SELL the case has faded, or a risk rule fired. Review it.
Step 2Start on Signals, filter to Buy
Open Signals and press Buy to see only fresh candidates. Each row carries the score, the action, and where the price sits in its range: green is low in the band, near support. Click a row for the quick stats behind it.
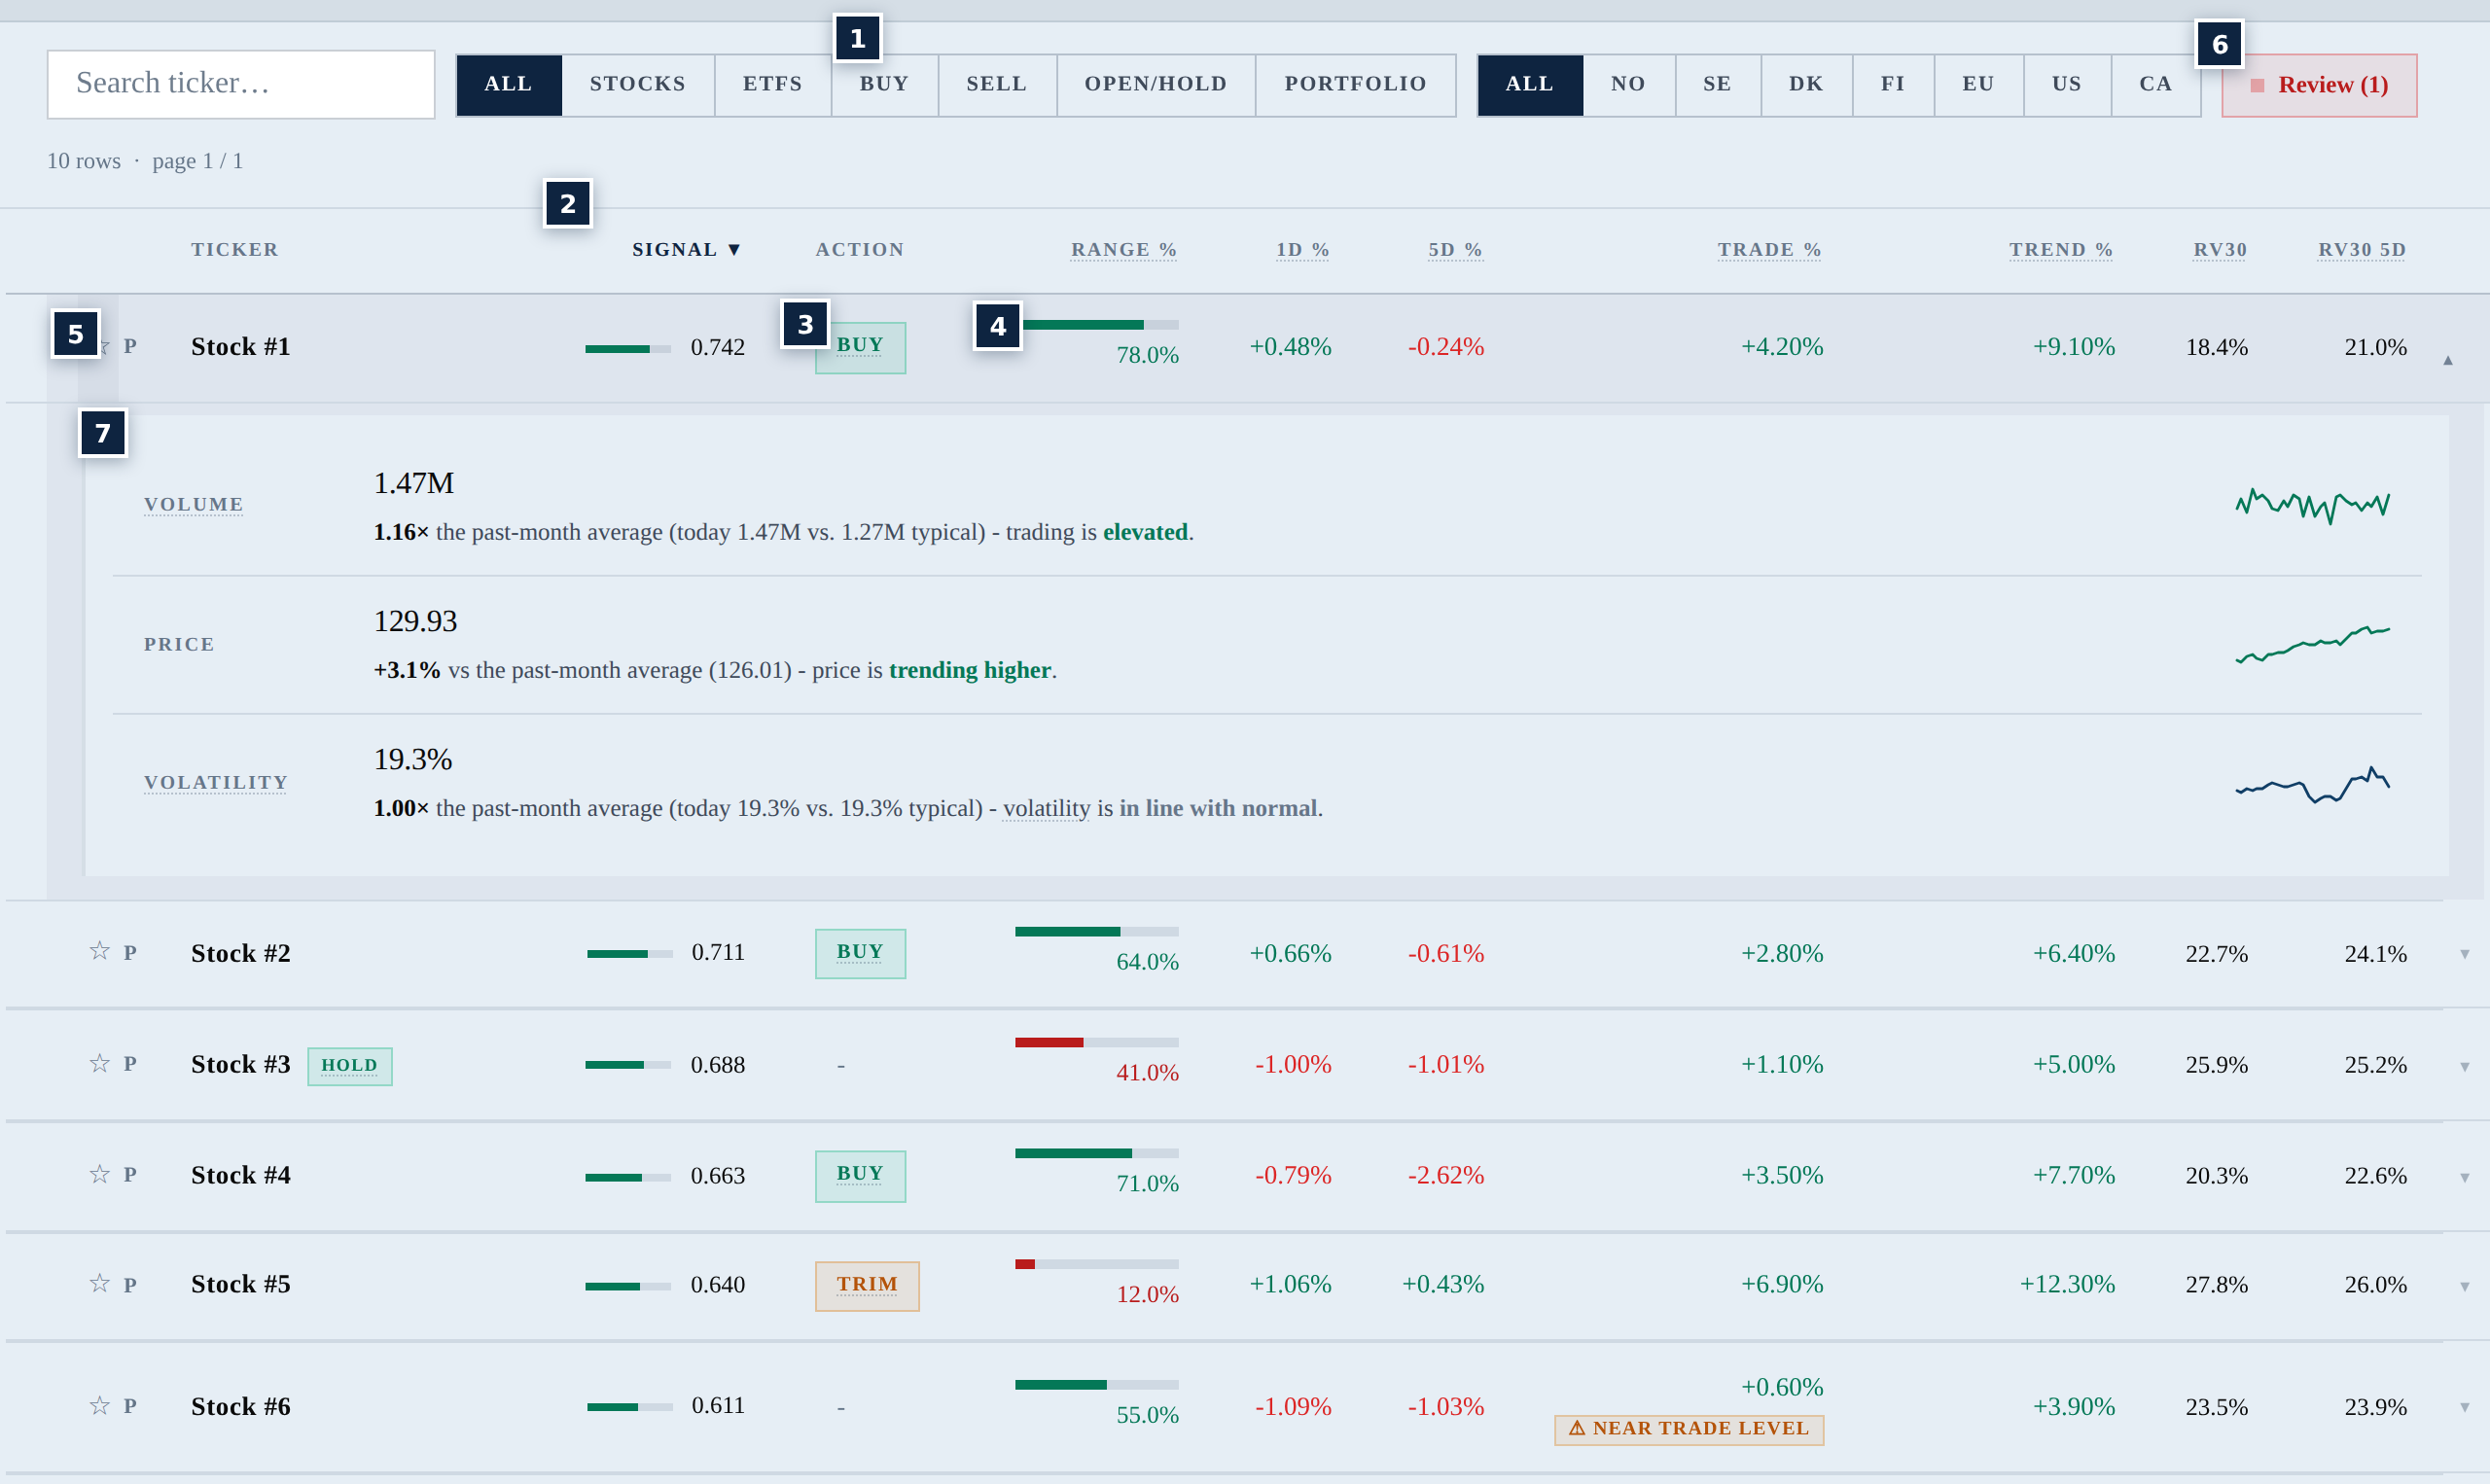
- 1Buy filter: only names the model would open today.
- 2Signal, the score. Click any heading to sort by it.
- 3Action: BUY, TRIM, SELL, or a dash for nothing to do.
- 4Range %: green and low in the band is the favourable zone.
- 5☆ adds the name to your watchlist, P to your portfolio.
- 6Review: your own names the model wants out of. Check it first.
- 7Quick stats: today's volume, price and volatility against the past month.
Step 3Check one name in full
Click the ticker. The top strip is the case at a glance: score and action, price against its trade and trend levels, and the model's record on this name. Under the chart: every trade it took over the published window, and why it got out.
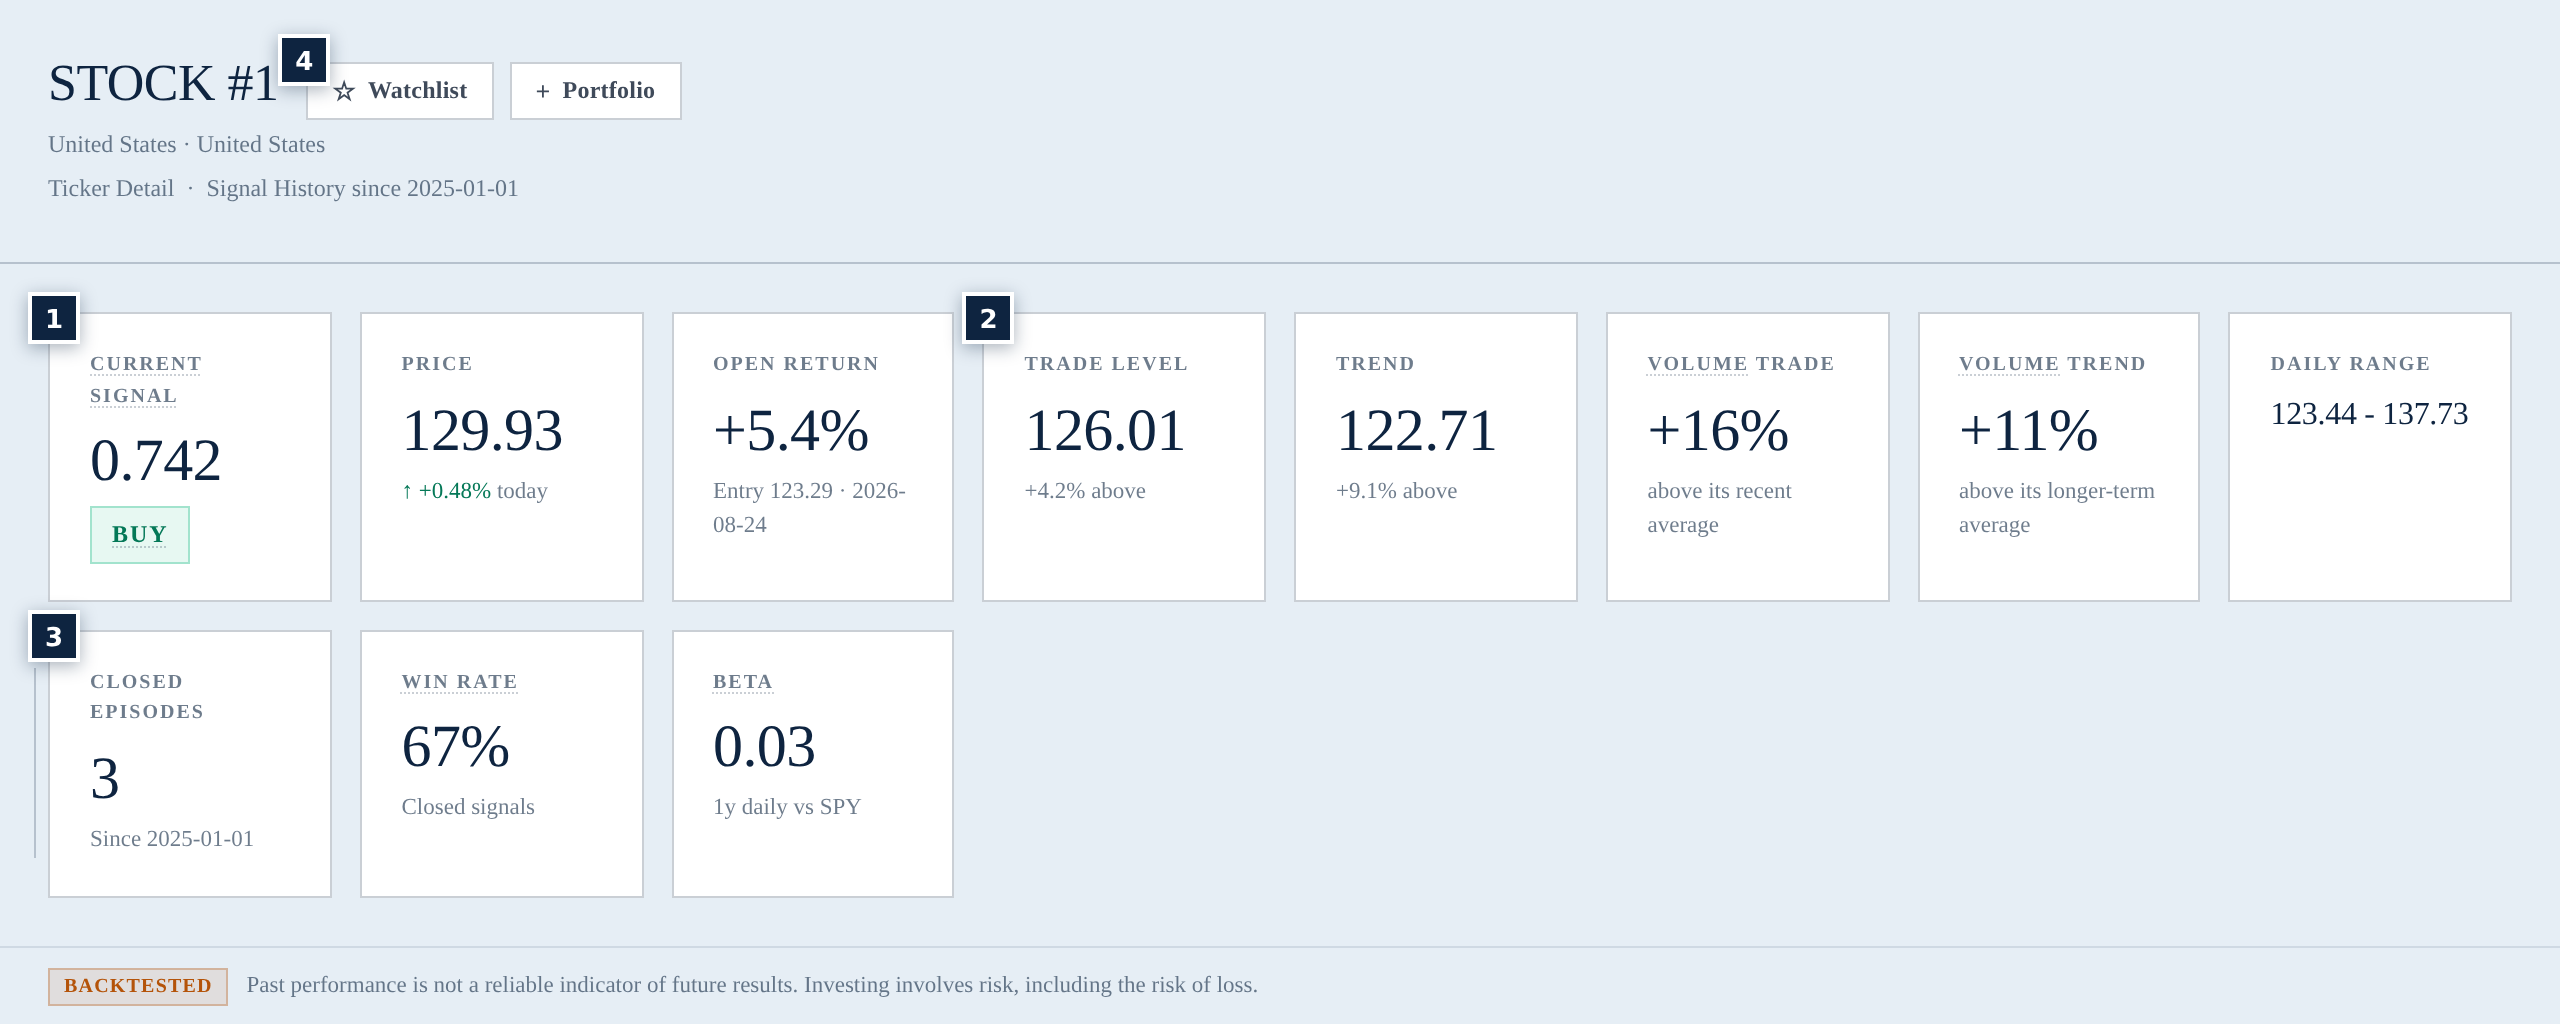
- 1Current signal and action for this name today.
- 2Trade level and trend: how far price sits above or below each.
- 3Closed trades on this name over the published window, and how many won.
- 4Watchlist and Portfolio, one click from here too.
Step 4Know when to get out
The model sells when its confidence fades, not when the price drops, so a winner can be sold while its price is still high. That is on purpose: it banks the gain before the case unwinds. Every exit carries a reason, and four cover most of them.
| Signal floor | Score below the exit floor for three sessions running. The most common exit; it cuts losers early. |
| Momentum break | A position well in profit whose trend broke on heavy volume. The winner is banked. |
| Volatility regime E or F | The name became too jumpy to hold, whatever the score says. |
| Macro risk | Market-wide stress: the VIX and the name's own volatility are both high. |
Signal History lists every trade since the record's start date and how it ended.
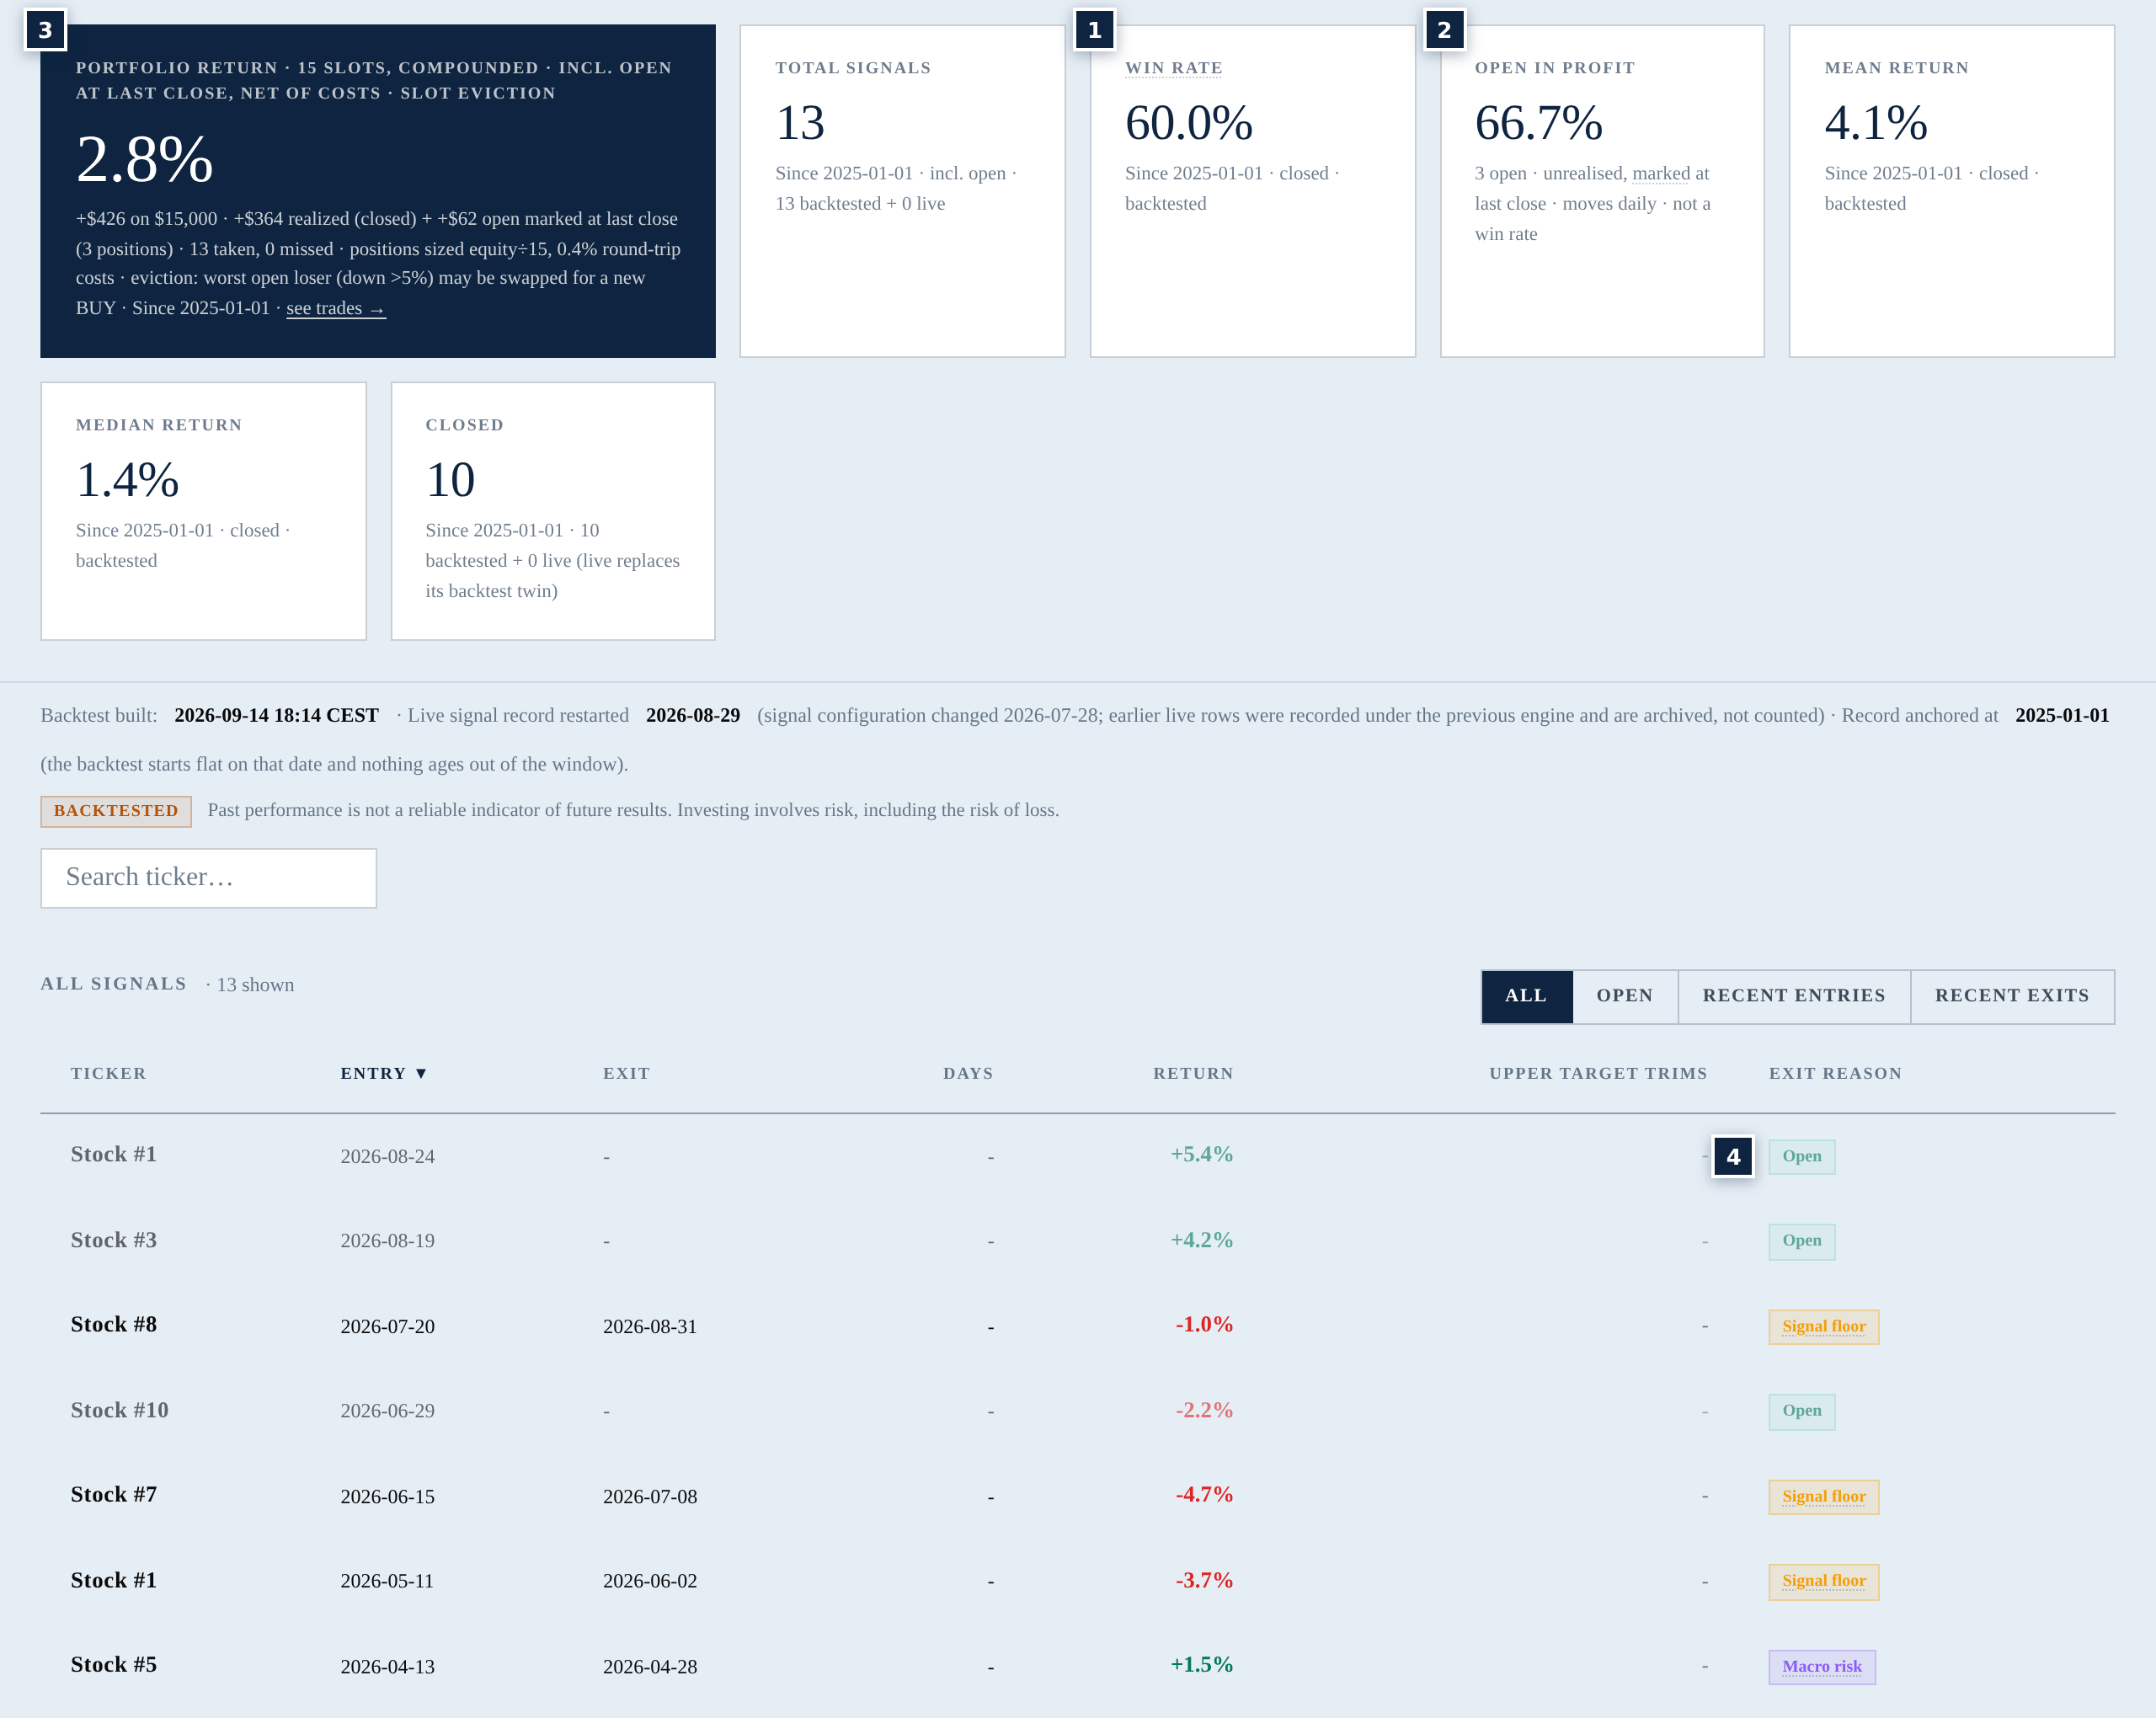
- 1Win rate: closed trades only, since the start date on the tile.
- 2Open in profit: the share of open positions above their entry price. It moves every day and is not a win rate.
- 3Portfolio: what taking every signal into a fixed number of slots would have returned, net of costs.
- 4Exit reason on every closed trade. Hover one for what it means.
Step 5Keep your own list
Star the names you follow, press P on the ones you hold. Portfolio & Watchlist then watches them for you: a weakening signal, two holdings that move as one, too much of the book in one currency. Everyone sees the same signals and the same rankings; your lists change what is watched for you, never what is recommended.
Step 6What this is not
Want more? The full guide walks through every page, and the methodology explains how the score is built.